Introduction
This article is about GNU applications useful for interfacing with the Csound API, and basic digital signal processing function modules in C/C++. Also included are examples of working with GNU applications and their libraries for the coding, linking, compiling, and plotting of data.
Shown below is a simple flowchart for the downloadable code accompanying this article.
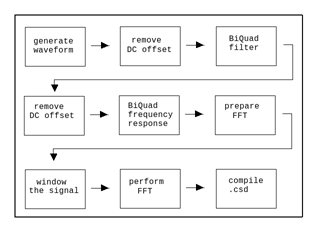
Figure 1. Diagram of accompanying code modules.
Download code for the above examples here: main.cpp.zip. This code should compile and run when linked with library dependencies which were likely built when you compiled Csound, such as libsndfile, csound64, and pthread. See the full command line shown at the end of this article for linking and running from the command line.
Csound 5.13, KDevelop4.1, and Fedora 14, were used for all examples in this article.
I. Csound API
The Csound API contains the useful methods csoundAddSpinSample and csoundGetSpoutSample that allows generating or manipulating signals at the sample level while interfacing with Csound. Certain lower level functions performed on samples, such as the Fast Fourier Transform, are generally best computed outside of the Csound algol-like orchestra and score using, for example, C/C++ and additional libraries such as FFTW3. Csound includes FFTW3 as a dependency package for compilation of the Csound application, and uses FFTW3 for several opcodes, but direct access to FFTW3 methods and flags are not available from within Csound.Working with the Csound API through a code environment, employing C/C++, and using an IDE (Integrated Development Environment) such as KDevelop, a problem also exists in terms of the availability of graphics libraries for plotting. Gnuplot is a good, solid plotting application with available libraries and an existing body of examples of code which demonstrate how to interface Gnuplot with C/C++. However, for this article it was decided to use Gnuplot as a standalone application, run from the command line, employing scripts, in order to avoid obfuscation of the code examples through additional complexity. Thus the code examples with this article employ file I/O to save arrays as data files which are then read and plotted by calling a Gnuplot .gp script. In this way the graphing functions remain separate from the signal generating and processing code, yet still perform the essential functions of plotting for accuracy and effectiveness.
II. GNU Applications
Prototyping Using Math Programs
Gnuplot is a plotting program, not a symbolic mathematics application. For symbolic mathematics the GNU application Octave, with contributed packages for signal processing and graphics is a good, free substitute for Matlab. Plotting from Octave can also be accomplished using a Gnuplot package for Octave.
Octave allows for developing matrix data, calculating FFTs, and plotting results. Octave employs various packages such as Signal, Specfun, Optim, and Gnuplot in order to use commands to generate signals, filter, window, and plot the signals. Symbolic math programs generally run as interpreted language, and are slower than compiled languages such as C, C++. However, some of their chief benefits are fast prototyping, available functions for testing results and providing file input and output, graphics, and powerful use in dydactic applications. In many cases, an idea, formula or theory working in a symbolic math program file suffices as proof of concept.
Although some symbolic math applications allow access to a compiler which can render an executable and source code for the various symbolic math functions, the resulting computer code can be made more complex by the amount of dependent methods and library functions which must be included with the code for the executable to work as a standalone application.
Linux and Spectral Analysis
Linux can be a difficult operating system for audio production due to frequent operating system upgrades, lack of a wide range of audio input/output devices and drivers, and digital audio editing and workstation software which is good, but not excellent. Additionally there is a real dearth of excellent spectral analysis tools for Linux. However Csound, originally a Unix application, continues to work well under the Linux operating system. Nevertheless having researched and auditioned several audio tools for Linux, it was decided to write a small amount of custom code using Gnuplot to help visualize audio input utiltizing the Csound API.
Csound is, of course, a software synthesis application, and Gnuplot is a plotting application. Occassionaly those facts become confused such as believing that Csound should contain more plotting and analysis tools, and/or that Gnuplot should contain more symbolic math functions. Ardour, however, is a good DAW for Linux, and Octave is a strong symbolic math application also for use on Linux. Although other symbolic math applications such as Numpy and Scipy were initially employed, those were eventually abandoned in favor of a simple standalone plotting application such as Gnuplot.
III. Signal Processing Functions
Signal Generation
Csound has numerous, high quality opcodes for signal generation. When designing sounds in Csound, often a table lookup method is utilized. If employing the csoundAddSpinSample method from the API to place individual samples into a Csound buffer, one approach to coding and sample generation is the creation of a function which generates one cycle of the waveform over the specified number of Csound ksmps. This cycle will then be repeated at the k-rate. Therefore the resulting frequency of the signal is the k-rate (SR/ksmps). In this way the notion of time is accomplished through notation in the score.
The example below shows a simple sine wave function which generates individual sample numbers for one period, suitable for a table to be performed at the k-rate.
double pi = 4 * atan(1.0)return Asample * (sin(2 * pi * 1/(SR/ksmps) * sample num))
In this case the sample num is each individual sample from an array of a particular size such as 1024 samples, and SR/ksmps equals the k-rate. In this manner, samples are generated which can be placed in a Csound buffer, which in turn is performed by a .csd file.
Because this method allows for working with code, where compilation must occur before any sound is generated, the possibility also exists for developing additional functions which may include the notion of time. These functions are more suitable for working with general signal processing routines, not only placing samples into a Csound buffer.
The example below shows a sine wave function which generates sample numbers for a given period, duration, and frequency (i, D, f). The number of samples could be similar to the typical Csound buffer size or greater or less than, and will allow the signal (individual samples) to be employed with filtering, windowing, FFTs, and graphics routines, since size, or the number of samples, determines length of time as the number samples per second.
double pi = 4 * atan(1.0)return Asample * (sin(2 * pi * i / D * f * sample num))
Another method of computing samples for a Csound buffer would be to compute the samples including the notion of time, as above, but only using the first period for sending samples to the Csound buffer, which would then be performed at the k-rate using a .csd file.
Complex Signals
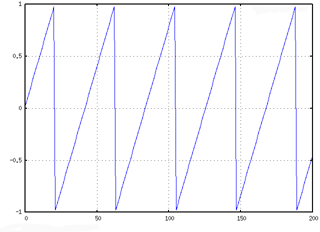
The figure below shows a portion of a triangle waveform output using Gnuplot which will extend beyond the samples shown for the size of the whole array. With Gnuplot, simple zooming can be accomplished by listing ranges for X, Y axis in the script file (plot [0:200] [-1:1] "td_sig.dat" with lines 3 ;set terminal x11 5).
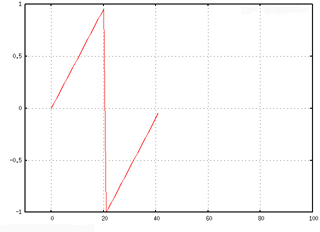
The next figure shows output as a single period of the triangle waveform, as a single channel, which could be placed on the Csound buffer via the Csound API to be as a lookup table, performed at the k-rate.
Other Signal Processing Functions
An array of floating point numbers, which represents a discrete signal, is further able to be modified through filtering, padding, truncating, etc. by the use of additional signal processing functions. For filtering in the time domain, a good example is the simple implementation of a Biquad filter by Tom St Denis, based on the work by Robert Bristow-Johnson, available from musicdsp.org. Although this filter exhibits startup costs at higher frequencies, it is fairly stable otherwise, and has become fairly ubiquitous, being modified, and employed throughout a number of open source applications.
This Biquad filter calculates filter coefficients based on the filter type (high pass, low pass, band pass, etc.) and will generate a sample by sample output of the filtered signal in the time domain. While Linux has several filter design applications, or applications which calculate filter coefficients, there is not much readily available information on filter implementation in software.By working with, and integrating a filter implementation, such as the Tom St Denis Biquad example, as well as plotting and managing the output, a better understanding of signal processing at the code level can be acquired.
For signal processing, in order to work effectively with arrays of numbers for audio processing, graphical output is essential for helping to determine the effectiveness and accuracy of those processes. Employing Gnuplot and scripts, several graphs may be output in sequence by running a .gp script file.
$ gnuplotgnuplot> load 'myscript.gp'
The following example shows a more complicated script for Gnuplot which will generate nine different graphs on Linux using X11. X and Y ranges are shown within brackets, file names are given, line style, and color is shown, and terminal output is set numbering the sequence of X11 windows as graphs.
set gridplot [-10:1000] "freqresp.dat" with lines 1 ;set terminal x11 1plot "td_filtsigWindowed.dat" with lines 3 ;set terminal x11 2plot "td_unfiltsigWindowed.dat" with lines 6 ;set terminal x11 3plot [0:200] [-1:1] "td_filtsig.dat" with lines 7 ;set terminal x11 4plot [0:200] [-1:1] "td_sig.dat" with lines 3 ;set terminal x11 5plot "fd_freqs.dat" using 1:2 with lines 6 ;set terminal x11 6plot "fd_filtfreq.dat" using 1:2 with lines 1 ;set terminal x11 7plot [-10:100] [-1:1] "Csound_tdFilt_L.dat" with lines 7 ;set terminal x11 8plot [-10:100] [-1:1] "Csound_tdL.dat" with lines 1 ;set terminal x11 9
Indicated above and also very useful is the script command to plot a particular column of data from a multi column data file. The flags "using 1:2" above indicate plotting the first column of data from a two column format of data, which is a common output for FFTs using real and imaginary values listed as separate columns.
Assuming the goal of processing functions is to interface with Csound, employing a .csd file to generate audio either in realtime or to a file, graphical output is again important for verfication of accuracy. While Csound has graphical output opcodes, a supplementary application such as Baudline works well on Linux and will show time and frequency domain graphs when loading, for example, a .wav file generated by Csound. Baudline is one of the best spectral analysis tools available for Linux, but has suffered as recent versions of Fedora, where for example fonts utilized by the application have been moved to different packages or in some cases become obsolete.
FFTW3
Another useful signal processing function is the ability to create frequency domain data from filtered or non-filtered time domain data. Csound compiles with dependency upon the FFTW3 library which is used for a number of opcodes, but FFTW3 can also be included externally as a library within a development application for generating transforms. Kdevelop for Linux has progressed nicely over several versions and is a good C++ development IDE. As of version 4, their use of .c templates was dropped, but c style code can still be employed using a .cpp file extension.
Several transforms are available from FFTW3, such as the forward discrete transform, which may be called by first establishing a plan. The plan takes several parameters such as "n", the logical size of the DFT, "in" which is the input array, "out" is the return, "FFTW_FORWARD" the direction of the transform, and "FFTW_ESTIMATE" a flag to optimize the computation which in this case is calculated as a reasonable plan without too much optimization based on the hardware and memory of the machine.
plan_forward = fftw_plan_dft_1d(n, in, out, FFTW_FORWARD, FFTW_ESTIMATE);
Thus transforms can be calculated from a body of code prior to sending any data to a Csound bus by including the FFTW3 library as part of a development environment. Transform data is useful also for graphing.
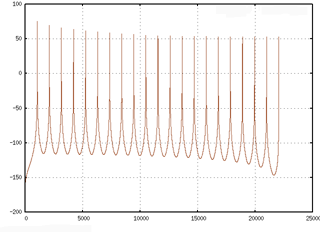
The ouput of FFTW3 in the above case is two columns of data: a real, and an imaginary part. Gnuplot can be utilized to plot the returned output values of FFTW3 using only the real numbers, but the plot may still require some additional shaping. Resulting data may require windowing to reduce side lobes, for example, or remove DC offset for a more normalized appearing spectrum, as well as setting of ranges in order to show a more handsome graph.
With the basic signal processing software functions such as sine, sawtooth, triangle, square, white, and pink noise generators, a biquad filter, FFT, windowing, and a DC offset filter, combined with Gnuplot it is possible to gain some measure of predictabilty over the samples that may be sent to a Csound buffer by utilizing data calculated in the time and frequency domains. In other words, the ability to inspect and evaluate data before utilizing the Csound API is very helpful and instructive.
The comparison of data output by Csound with that of the input samples is also very instructive and forms a digital system whereby one is able to obtain and verify a reasonable amount of accuracy. Baudline was mentioned earlier as a solid graphing tool for Linux in order to load, for example, a .wav file generated by a Csound .csd file. Therefore by comparing the output compiled and generated by Csound, a system of input and output verification assures reasonable accuracy of data, assuming coded DSP functions are reasonably solid.
IDE and command line compilation
Kdevelop 4.1 is an excellent IDE for Linux which utilizes the Cmake build system. Since the build will likely use gcc or g++ as a compiler, it is also possible to work directly from the command line instead of using an IDE.
In order to compile from the command line with dependencies which include Csound libraries, it may be necessary to run initial startup scripts, especially if your Csound build and installation has been placed in a non-standard location. For example you may need to export LD_LIBRARY_PATH, OPCODEDIR, OPCODEDIR64, and RAWWAVE_PATH variables according to your Csound location.
Once the variables to particular paths are set, then something close to the commands below for the g++ compiler with command line flags should also compile the example files if working from the command line, outside of an IDE.
g++ -Wall -O2 -IH -o test main.cpp-L. -lcsound64 -lsndfile -ldl -lm -lpthread -lfftw3
Conclusion
Csound is an excellent software synthesis application for signal generation as well as signal processing. If working with the Csound API, and generating signals to send the API, in order to better be able determine the accuracy of those signals as samples it may be necessary to interface using additional applications, custom code, and libraries. GNU applications offer a sensible solution for this problem and provide several benefits such as filtering, Fast Fourier Transforms, and plotting.
Related Links
John W. Eaton, "Octave," 1998 - 2011. [Online]. Available: http://www.gnu.org/software/octave/. [Accessed Feb. 24, 2011].
"Gnuplot," September, 2010. [Online]. Available: http://www.gnuplot.info/. [Accessed Feb. 24, 2011].
SigBlips.com, "Baudline," 2010. [Online]. Available: http://www.baudline.com/. [Accessed Feb. 24, 2011].
Matteo Frigo, and Steven G. Johnson, "FFTW". [Online]. Available: http://www.fftw.org. [Accessed Feb. 24, 2011].
"KDevelop," December, 2010. [Online]. Available: http://www.kdevelop.org. [Accessed Feb. 24, 2011].